Задача 70467 упражнение 2-4...
Условие

английский язык колледж
253
Решение
★
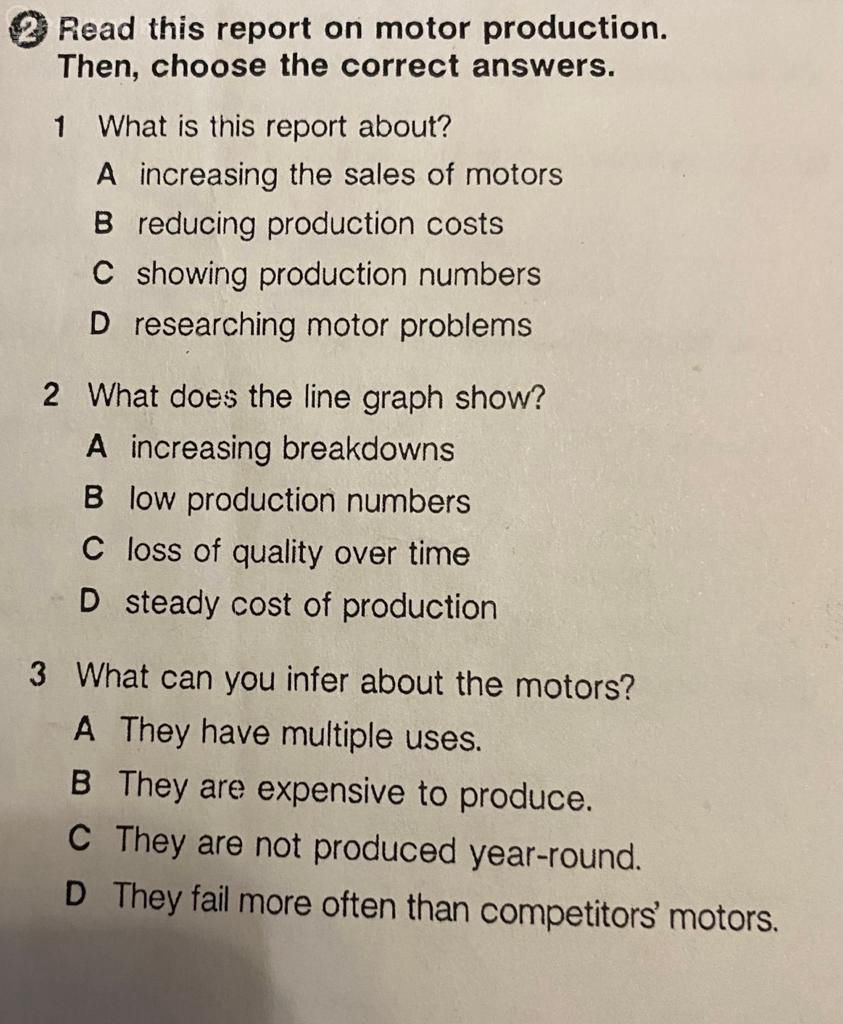
2. D) steady cost of production
3. A) They have multiple uses.
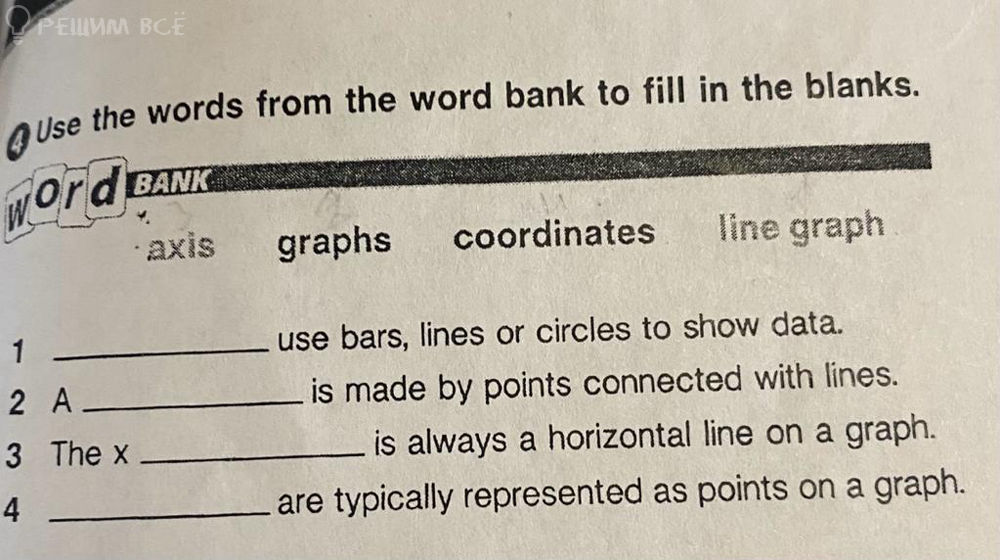
4) 1. Graphs use bars, lines or circles to show data.
2. A line graph is made by points connected with lines.
3. The x axis is always a horizontal line on a graph.
4. Coordinates are typically represented as points on a graph.